The income dashboard gives you a live view of your earnings, session count, and average session value — without any manual tallying.
Getting there
Go to Income in the nav. You'll see your figures for the current month by default.
Choosing a time period
Use the toggle in the top right to switch between:
- This month — the current calendar month from the 1st to today
- 3 months — the last three months combined
- 12 months — the last twelve months combined
- Month… — pick any specific month from the last 12 to view it in isolation
All three summary cards and the service breakdown update when you switch period.
Exporting to CSV
When the selected period has appointments, an Export CSV button appears. It downloads the full appointment list for that period — one row per session with date, client name, service, amount, and whether it was covered by a treatment package. Useful for your own records or sharing with an accountant.
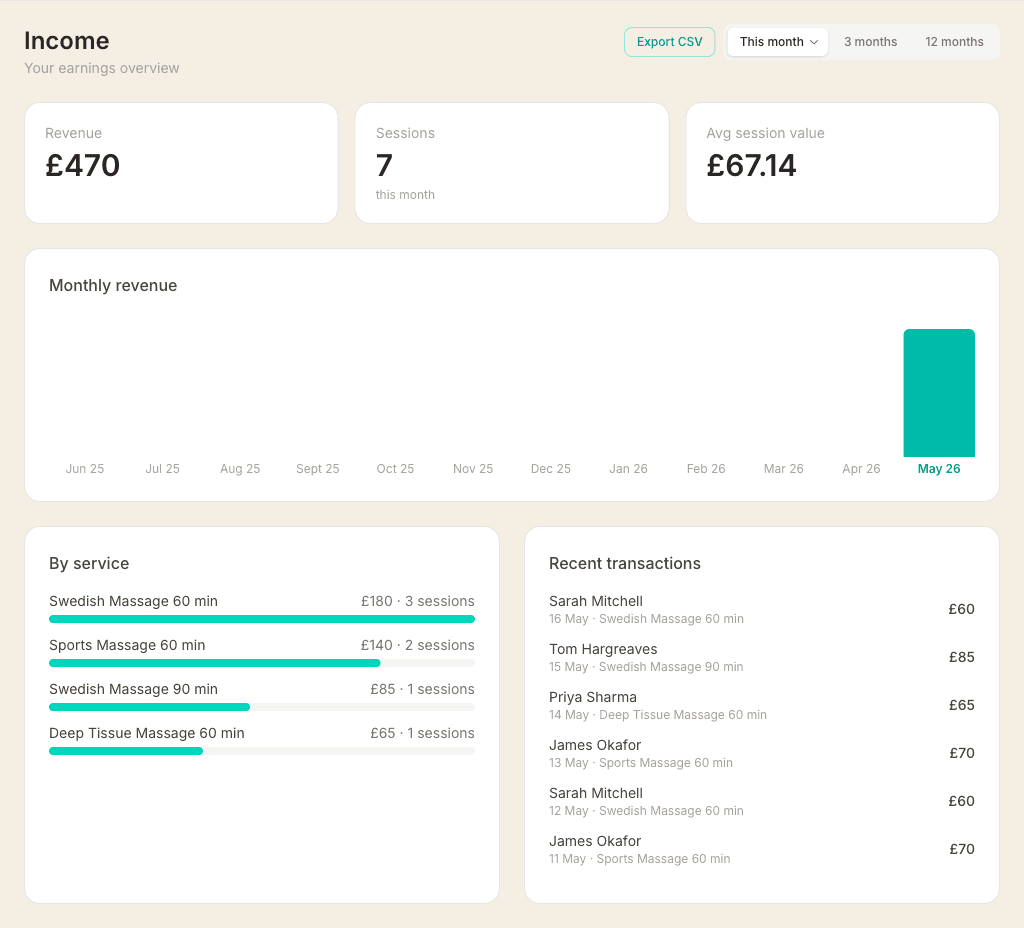
Summary cards
- Revenue — total income from completed and confirmed sessions in the period. When viewing this month, a small indicator shows the percentage change vs last month (green for up, red for down).
- Sessions — total number of appointments in the period
- Avg session value — revenue divided by sessions. A useful indicator of whether your pricing is changing over time.
Monthly revenue chart
The bar chart always shows the last 12 months, regardless of the period toggle. The current month is highlighted in teal.
Hover over any bar to see the exact revenue figure and session count for that month.
Revenue by service
Shows which services are bringing in the most money during the selected period, ranked by revenue. Each row shows the service name, total revenue, and session count — with a bar showing its proportion relative to your top earner.
This is useful for spotting which treatments are worth promoting and which are rarely booked.
Recent sessions
A list of your most recent sessions in the selected period, showing client name, date, service, and charge amount. Up to 20 sessions are shown.
Discount performance
Below the main stats, the Discount performance section breaks down how your discounts are affecting revenue — for the selected period.
The Total discount given card at the top shows the combined value of all discounts and its percentage of gross revenue (what you would have earned without any discounts).
Below that, four cards show each discount type:
- Green bookings — how many bookings used a green booking discount, what percentage of total bookings they represent, and the total discount amount given.
- Back-to-back — the number of back-to-back groups and appointments in the period, total discount given, and average appointment value with vs without the discount.
- Memberships — active member count, average treatments per member per month, churn rate, and average membership duration.
- Gift cards — number of cards sold in the period, total value sold, total redeemed (via appointments), and the outstanding balance across all active cards.
If you sell treatment packages, a Treatment packages table appears below the cards showing units sold, sessions redeemed and remaining, and average days between redemptions per package type.
What's included in the figures
Only appointments with a confirmed or completed status are counted. Cancelled and no-show appointments are excluded. The revenue figures are based on the service price set at the time of booking.